
htop 3.5 System Monitor Released with Backtrace Screen, New Meters

htop 3.5 Drops with a Fresh Coat of Paint and Turbocharged Monitoring Tools
After a year-long wait, the beloved system monitoring tool htop has finally unleashed version 3.5 — and it’s not just a maintenance release. This upgrade brings a slick new interface, powerful new meters, and a slew of platform-specific enhancements that make it the most polished and feature-rich htop yet.
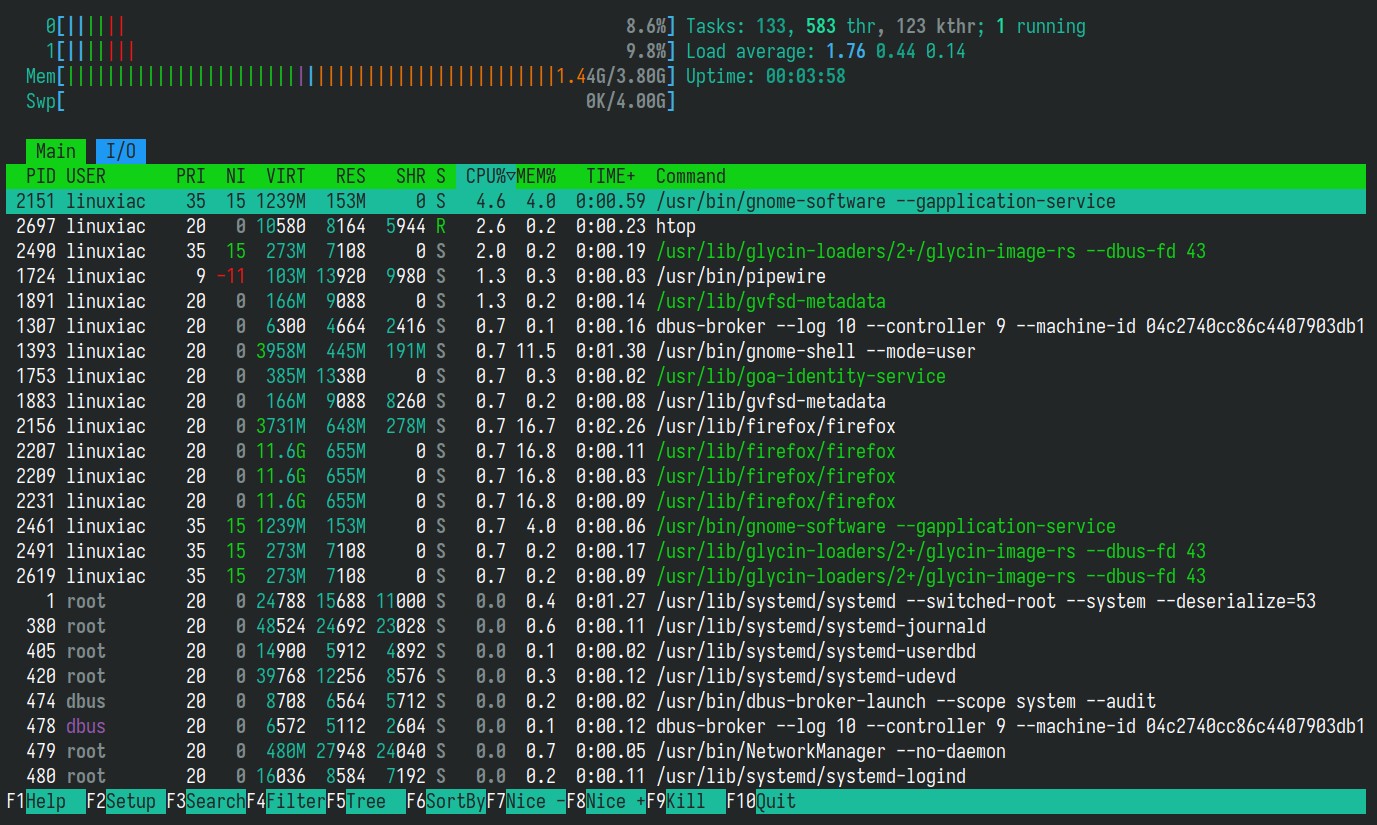
For the uninitiated, htop is the de facto terminal-based interactive process viewer — a next-level evolution of the classic top command. It offers real-time insights into running processes, CPU and memory consumption, and a treasure trove of system stats, all wrapped in a colorful, keyboard-friendly UI that lets you sort, filter, and drill down into processes with surgical precision.
A Fresh Interface, Smarter Controls
htop 3.5 introduces a line editor for Search, Filter, and screen renaming — meaning you can now type directly instead of cycling through options. Numeric settings can be edited digit-by-digit, making tweaks faster and more intuitive. The update also honors the NO_COLOR environment variable, giving users explicit control over terminal color output.
A brand-new Nord-inspired color theme joins the lineup, offering a sleek, low-contrast palette perfect for long monitoring sessions. And if you prefer a minimalist experience, two new flags — --no-meters and --no-function-bar — strip away extra visual elements for a clean, distraction-free view.
New Meters and Monitoring Magic
The monitoring muscle of htop has been seriously bulked up. A backtrace screen based on libunwind-ptrace now lets you peek into process call stacks, while the new SecondsUptimeMeter shows system uptime with millisecond precision.
CPU enthusiasts will appreciate the new SMT (Simultaneous Multithreading) label option, which makes logical CPU cores easier to distinguish. Temperature monitoring gets a boost with Tctl readings, and both graph and bar meters now behave more consistently across platforms.
Disk I/O monitoring has been overhauled: the DiskIOMeter is now a combined two-part display, and two new meters — DiskIORateMeter and DiskIOTimeMeter — provide granular insight into read/write speeds and I/O timing.
Linux Gets a Power Boost
Linux users are in for a treat. htop 3.5 now supports the OpenRC init system and its associated metrics, expanding its compatibility with niche and embedded Linux distributions. It also improves parsing of CPU frequency data from /proc/cpuinfo, fixes detection of NUL-separated arguments, and skips loopback and MD (RAID) entries in /proc/diskstats for cleaner output.
Cross-Platform Polish
It’s not just Linux that benefits — every major platform gets love in this release.
On macOS, GPU meter code has been added, OS release reporting is more accurate, SysArchMeter now reports version info, and process CPU time conversion has been restored.
FreeBSD updates its internal priority reference point for more accurate process sorting.
NetBSD improves process state retrieval, making status indicators more reliable.
OpenBSD fixes AC power reporting when the value is nonzero and updates documentation for ACPI battery and AC sysctl indices.
Solaris now refreshes memory information with every update cycle, ensuring you always see the latest stats.
Under the Hood: Speed and Stability
htop 3.5 isn’t just about flashy features — it’s faster and more stable under the hood. Startup latency has been slashed by removing the initial enforced delay. Boot time is improved by caching getpwuid results (used for username resolution). The tool now avoids writing the htoprc config file when it isn’t owned by the effective user ID, preventing permission-related crashes.
Packaging has also been improved, with new definitions for openSUSE and SLES, making it easier for enterprise Linux users to get up and running.
Get Your Hands on It
As always, htop is distributed as source code upstream. Precompiled binaries are typically available through your Linux distribution’s package repositories or other OS package managers.
For the full changelog and technical details, check out the official changelog on GitHub.
htop, system monitoring, terminal tools, Linux utilities, htop 3.5, process viewer, cross-platform, open source, system stats, CPU monitoring, memory usage, disk I/O, macOS, FreeBSD, OpenBSD, Solaris, OpenRC, NORD theme, NO_COLOR, libunwind-ptrace, uptime meter, SMT labels, Tctl temperature, startup speed, config file, package managers, interactive UI, real-time monitoring, process management, tech upgrade, developer tools, system admin, performance tuning, terminal UI, software release, GitHub changelog
🚀 htop 3.5 is here — sleeker, faster, and more powerful than ever!
🎨 Fresh Nord theme, smarter search, and blazing startup speed.
⚡ Linux, macOS, BSD — everyone gets a boost.
📊 New meters, better I/O, and deeper system insights.
🔧 OpenRC support, bug fixes, and enterprise-ready packaging.
🔥 Don’t miss the upgrade — your terminal just got a serious glow-up!
,


Leave a Reply
Want to join the discussion?Feel free to contribute!